Work always involves boring, repetitive operations that drain energy. Because they are both laborious and time-consuming. Solution 1 – Hire someone else to do it. Often in the early stages of a career, we don’t have enough money to hire someone. Moreover, it’s difficult to find someone willing to do this type of work. Solution 2 – Automate. A simple (and free) automation tool is Excel. All the 🎁 spreadsheets in this blog are small automation products that have been effectively applied to real-life construction design situations. Here are some experiences that may be helpful to everyone.
Computer science is a basic skill needed in the 21st century, along with English. Just look at elementary school children who have learned programming, so engineers must also be involved. Unlike children who learn at school, adults only learn the necessary job skills, and do not need to go to school. Self-study is the most effective way, especially in the age of the internet reaching to the bed like now.
Part 1 | Basic Excel
Structural calculation is an important and time-consuming task for design engineers. Creating an Excel spreadsheet for automation is a labor of sowing seeds: suffering once, using it for life. Because the design process is like sculpting a statue, it must be refined and recalculated many times to get a balanced and satisfactory result. Having a spreadsheet will greatly shorten the time to get a perfect result. Experience shows that just using the functions and functions available in Excel is enough for most professional needs. If your Excel skills are not very good, it’s okay, just get started, and Google whatever you get stuck on. It’s hard to remember all the necessary operations when you first start.
Presentation
The presentation of the spreadsheet is also important, because the product is printed and inserted into the calculation explanation book of the construction design document.
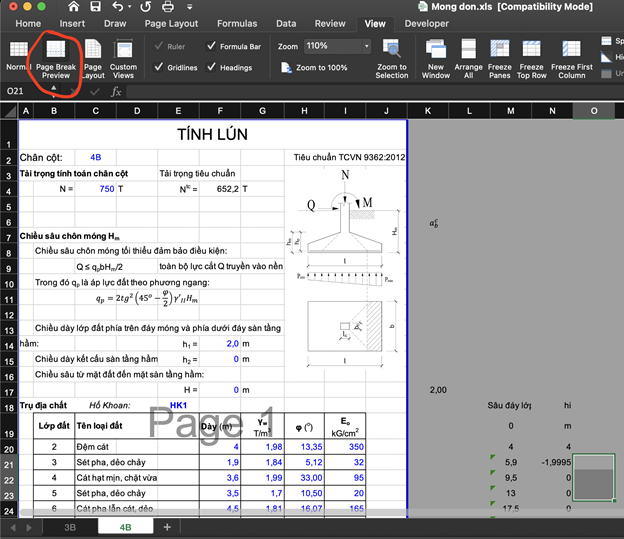
First, set the paper size, usually A4. Select View>Page Break Preview to show the width of the paper size, how many columns it occupies in the spreadsheet. Then adjust the width of the cells to have enough space to display numbers and notes.
Usually, the cells for entering data from the keyboard are marked separately, distinguishing them from the calculation result cells. You can mark them by choosing a different color for the text or background color of that cell.
There are quite a few input parameters: size, material grade, load or internal force of the structure, … The output results are often from calculations of steel reinforcement, stress, deflection, settlement, … Many calculation cells that do not want to be included in the printout are placed outside the Page Break print area.
Commonly used functions
Excel provides many built-in functions for calculation purposes. They are very powerful, can meet most of the needs of engineers. They can even do iterative calculations.
For example, the difficult iterative calculation part of the shallow foundation settlement calculation problem. The settlement calculation process using the familiar layer addition method is as follows
1. Divide the soil under the foundation into element layers, the maximum thickness is b/5. (b is the foundation width)
2. At the depth z (from the foundation bottom) of each element layer, calculate
Stress due to self-weight of soil $\sigma_z^{bt}=\sigma_{z=0}^{bt}+\sum{\gamma_ih_i}$
where: $\sigma_{z=0}^{bt}$ is the stress due to the self-weight of the soil at the foundation bottom elevation (z=0)
where: $\sigma_{z=0}^{gl}=p-\sigma_{z=0}^{bt}$ is the settlement stress at the foundation bottom elevation (z=0)
p is the pressure under the foundation bottom caused by the load
Ko is the coefficient that takes into account the change in depth of the settlement stress, depending on the depth z and the foundation size l, b. You can refer to table C.1 of TCVN 9362:2012. But to create a spreadsheet, it is more convenient to use the original formula to calculate Ko (according to the theory of Soil Mechanics):
Settlement of element layer is calculated by formula
$$S_i=\frac{\beta}{E_o}\sigma_z^{gl}h_i$$
3.Increase z depth to next element layer. Repeat step 2
Until $\sigma_z^{bt}>5\sigma_z^{gl}$ then stop the loop (if the soil is weak, replace 5 with 10). This is the condition to turn off settlement.
How to perform the loop here line by line. Each copy down is the next step of the loop, corresponding to the increasing value of z.
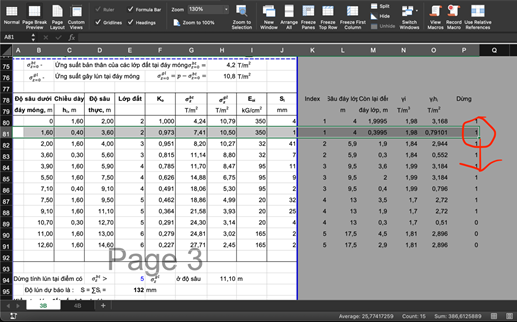
Starting from line 80 in the attached xls file.
Step 1 includes 3 columns:
Column B: is the value of z
Column C: thickness of the hi element layer
Column D: actual depth, calculated to the ground surface. Formula: depth of the foundation bottom (with the 💲 sign because this value does not change when copied down the line) plus z (column B).
The first line (80) corresponds to the foundation bottom elevation (z=0): cell B80 is equal to 0. From the next line, just add the current element layer thickness to column B. Therefore, column B represents the jump of the loop, corresponding to each element layer.
To calculate column C, we face a difficult problem of choosing the thickness of the element layer to stop at the exact depth separating the two soil layers. If we cannot solve it, we have to manually enter the thickness of each layer. This will be quite annoying because it is not fully automated. For example, here, the bottom of the foundation is at a depth of 2m, in soil layer number 2. At a depth of 4m (cell M20), it is the bottom of layer number 2, starting with layer number 3. If the thickness of this element layer is max=b/5=1.6m; we have 0.4m more to reach the bottom of soil layer 2. That is the thickness to choose for the next element layer (cell C81)
To make Excel follow the process described above, we need to add a few intermediate calculation steps (columns K, L, M outside the print area).
Column K: get the index number of the current soil layer corresponding to the depth z. Use the important search function MATCH. From here, determine the values for columns L and E.
Column L: depth to the bottom of the current soil layer corresponding to depth z. Use the INDEX function from column K. Purpose to determine column M
Column M: remaining thickness to the bottom of the current soil layer from depth z. Simply by subtracting column D from column L.
Here, we can determine the thickness of the element layer for column C. Just take the smaller value of b/5 and column M. Trap another case of encountering the bottom of the soil layer when column M is 0 using the IF function. Finished a difficult step 🍺
Column E: soil layer name corresponding to depth K. This column is meant for easy tracking in the printed spreadsheet. Similar to column L Also use the INDEX function from column K to get the soil layer name column (B20 to B27) from the geological column input data table.
Go to step 2:
Column F: value of Ko. The first row is equal to 1. The following rows use the formula mentioned with the ATAN, SQRT functions in addition to addition, subtraction, multiplication and division. The method is too simple compared to the step of determining hi even though the formula looks scary. Note to use enough parentheses, if there is ( then there must be ). And use 💲 for constant values when copying down to perform the loop.
Column H: value of $\sigma_z^{gl}$, simply determined according to Ko
Column G: value of $\sigma_z^{bt}$. We need to use additional intermediate columns N, O. Each loop step, the value of column G is cumulative, showing the increase in stress due to the weight of the soil itself according to the depth.
Column N: Get the value of the natural density γi of the soil corresponding to the depth z from the geological column data table. How to use the familiar and powerful INDEX function from column K.
Column O: $\gamma_ih_i$, converts from unit weight to stress. The value of O is used to add to σbtz each loop step.
To the settlement calculation operation:
Column I: value of deformation module Eo from geological column, also using the familiar INDEX function.
Column J: settlement of Si element layer according to the formula
Step 3: perform the loop by copying from line 81, the operation is to select the entire row (from column A to column P, including intermediate cells outside the border). Move the mouse to the lower right corner of cell P81. When the mouse shows a + sign, drag down. The calculation cells will automatically jump numbers.
Drag to where to stop? We add column P to show the stopping condition as follows. Use the IF function with the stopping condition being column G greater than 5 times column H. Then the value of column P is 0, otherwise it is 1. In fact, column P only has 2 values 0 or 1. The purpose is to calculate the final settlement (cell E95) by column J multiplied by column P. Any row with column P value equal to 0, the settlement Si of that element is not included in the final cumulative settlement S. This operation allows us to drag the mouse down comfortably instead of having to carefully check whether the new row satisfies $\sigma_z^{bt}>5\sigma_z^{gl}$ or not.
Note that after typing the formula to multiply 2 columns in cell E95, we need to press the key combination Control + Shift + Enter instead of Enter as usual.
Okay, so we have a settlement calculation table using the layer addition method completely automatically. In foundation design, this is a rather difficult problem and takes a lot of time. Having a productivity table will increase significantly. So engineers just need to gradually explore the depth and size of the foundation to obtain the settlement condition within the allowable range.
🎁 attached Excel file illustrates the above example
So we see that in addition to the basic functions, to perform the loop, this spreadsheet uses functions belonging to the search family: MATCH, INDEX.
If you do not understand a function, you can google. For example, typing “microsoft excel match function” will immediately give the first result which is the Vietnamese page of Microsoft. It clearly explains the usage, syntax and illustrative examples for this function.
If Vietnamese websites do not have enough information for you to learn, google English. The number of results is greater and you can find a solution quickly. The possibility of finding good solutions is very high. Simply because the number of users is global compared to the number of Vietnamese users. If your English is not very good, you can use Google Translate.
For example, if you want to learn about how to make a loop, use the keyword “excel create loop without programming” and put it in the translation, then paste the English into Google search. The result is one of the famous computer science forums, StackOverFlow, which has a lot of creative sharing.
The above illustrates a real-life example of how Excel can automate so wonderfully. If there are any parts that I have gone through too quickly and do not understand, please comment and contribute.
The next part will talk about simple VBA programming in Excel to create spreadsheets in complex loops where built-in functions cannot be used.